Are You Getting In-Depth KPI Reporting Data From Your Calls, Texts and Power Dialing Campaigns?
If you use a business phone system, you’re already making calls and texts to reach your clients, leads, and vendors. Why not harness the information you’re getting from communication to craft your future strategy? Whether it’s for phone number tracking, coaching agents, or scheduling staff, your calls and texts provide invaluable insight into your business.
Key performance indicators (or KPIs) should be standard for sales-based businesses. Any manager or business owner knows that continually viewing call tracking metrics and performance KPIs is the only way to grow intelligently.
Turn your raw data into easy-to-view reports providing summaries of your call and text communication.
Thorough KPI Reporting Includes Inbound and Outbound Communication
Outbound communication feels easiest to control: it’s you and your team making the calls and sending the texts. But inbound communication also provides a wealth of information that can shape your strategy. Even if you’re not doing phone number tracking (though maybe you should be!), there’s plenty of information to be distilled into reports from the calls and texts you receive.
Busiest Times for Inbound Communications: Unlocking When You Get the Most Calls
Try to guess when your business gets the most incoming calls. Is it lunchtime because people have a break? Is it at 3 PM during the afternoon lull? Maybe the weekends? Guessing can be informed by experience, but data is your ultimate source of truth. Discovering when you get the most inbound calls isn’t just fascinating, it helps you make actionable decisions around staffing up (or down!).
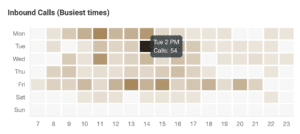
A visual heatmap can quickly show when your business is getting the most calls:
The goal of a good report is to feed you information quickly, in a way that makes sense. Heatmaps are a great example of this: your eye goes straight to 11 AM on Wednesday mornings – your new favorite time to be by the phone!
With this information, you can:
- Ensure you have employees scheduled around busy times, and prep them to be ready for calls
- Staff down during your quietest periods – maybe you only need 1 person on-call rather than 2 during your quietest days/times
- Change your business hours to more accurately reflect when customers, leads or patrons are most likely to call – maybe you’re surprised how many people attempt you before you’re open, but never leave a voicemail!
Call Tracking Metrics for Marketing Campaign Analysis
Phone Number Tracking doesn’t have to be a complicated process to yield revenue-boosting results. To put it simply, a Call Tracking Number is simply any phone number that you’ve dedicated to one marketing campaign or channel so you can track its efficacy.
Let’s say you buy 10 phone numbers, put each one on your business’ flyer, dispersed in 10 different neighborhoods. Everyone will see the same branding, but depending on your location, they’ll see a different number. The inbound calls you receive about your services illuminate which areas are most likely to yield a customer. Eight of those flyers didn’t get you a call? Focus more on the two that did!
The data can go even deeper: you may get more calls from one flyer, but the most sales from another. From that data, you can extrapolate that leads are more likely to turn into customers in one area, despite the volume of another. You’re building out deal or lead data just using phone numbers and KPI reports.
Here’s a hot tip: the best way to do Call Tracking efficiently is to use nicknames for your numbers. You’ll quickly see an inbound caller used the number for “Lawrenceville, NJ Billboard” and not “Trenton, NJ Billboard.” At smrtPhone, we call them Friendly Names!
Agent and Team Performance Optimization Starts with Data
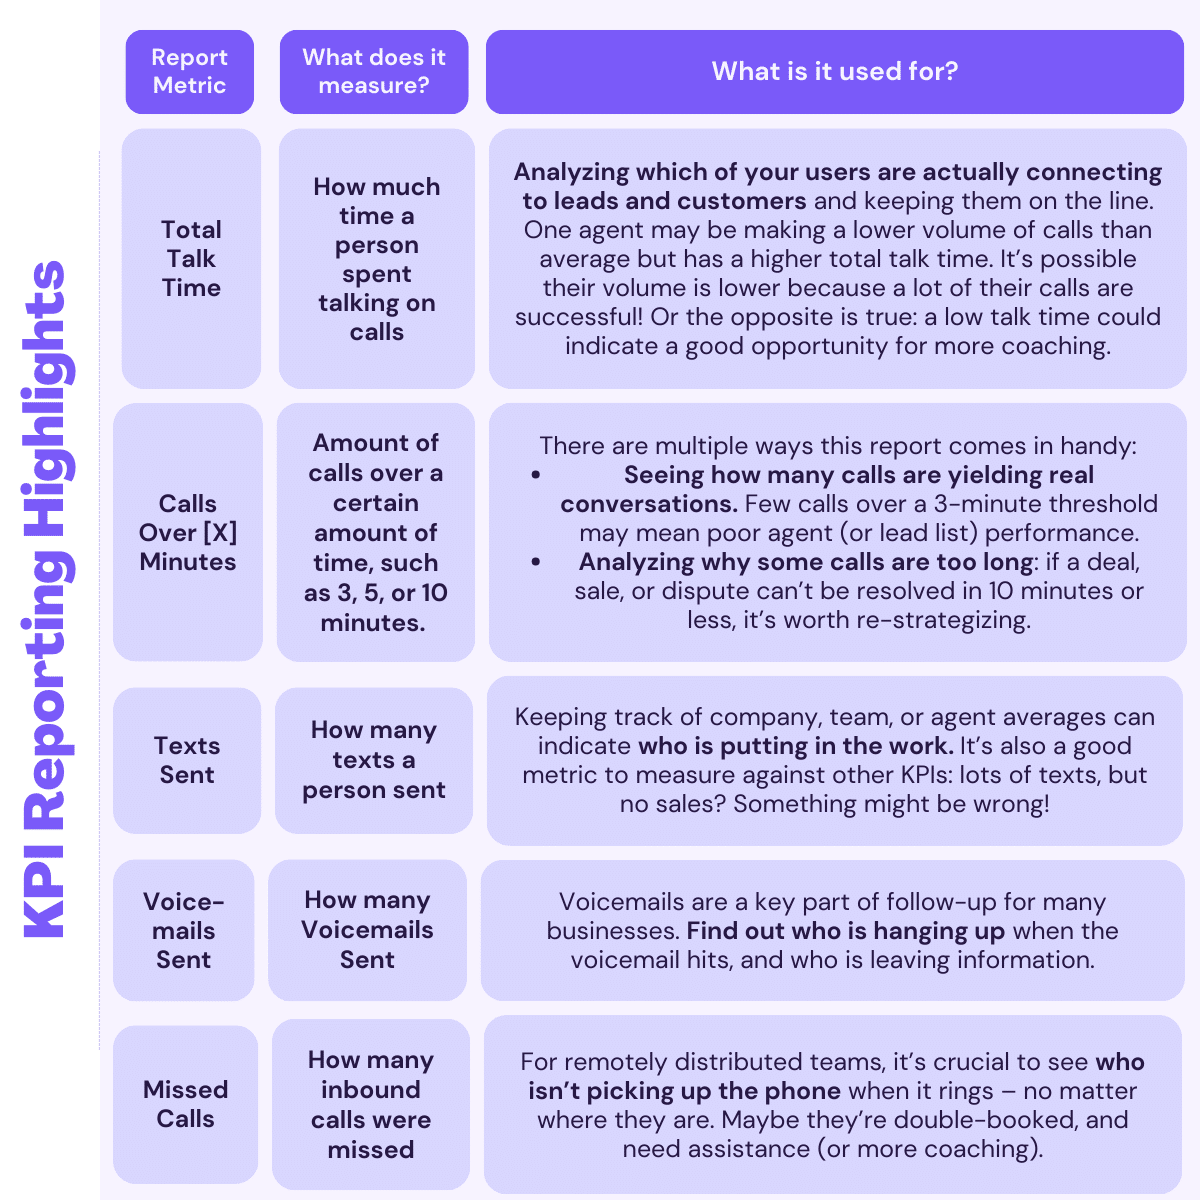
Whether you’re QA-ing a new employee, checking in on the whole team, or comparing agents’ performance, you must get the most accurate view. Visualizing data from calls and campaigns is a great way to review employee performance. Here are just some examples of metrics that you can apply when looking at team performance:
By paying attention to what your team is doing, whether daily or quarterly, you’re gaining a realistic picture of how your business is running. It’s important to take action from the information you’re learning from these key performance indicators. Here are some tips and tricks to turn data into doing:
- Monitor the employees who are under-performing. Turn on Call Recording for the Agents who have a high volume of calls, but poor customer service ratings or low sales. You might learn why.
- If you have smrtPhone Pro, you can listen in to calls live, potentially allowing you to coach them through issues using our ‘Whisper’ feature (don’t worry, the other person can’t hear a thing!).
- Use Call Recordings to keep a record of your best-performing agents making great calls. They can be used for training (or to give great performance reviews with examples). Obviously, Call Recordings can be used for the other side of the coin, too: keeping a record of poor performance, and quality assurance for every type of employee.
- Implement Call Scripts that agents can lean on during calls, especially those who underperform, or have unusually long talk time.
- Swap out or park phone numbers that lead to poor performance, even in the hands of good agents. It’s possible the number has been compromised and is showing up as “Spam” through no fault of your business or agent.
Remember, these are just some examples of metrics you can use to better your overall business performance. Get creative with how you build reports! Maybe you want to see your newest agent compared to your most veteran or compare this time last year to right now.
Flexibility is part of the smrtPhone ethos, so we’ve made our reports just as customizable as the rest of our products: as simple or as complex as you need. (And easy to download and export if you want to get even more complex – we don’t mind!).
Once you pinpoint where your successes and failures are happening, it’s easier to replicate lucrative behavior and cease what isn’t working. Tune in later this month for another blog on Power Dialing Reporting – why do some campaigns work and some flop? You might already have the answers in your data!
Interested in seeing these reports for yourself? Try a free smrtPhone Trial today!


